EquBot Custom AI Signals
Custom Ratings, Scores, Rankings, and Price Prediction
1M
Each day, EquBot analyzes over one million global news articles, social media posts, financial statements, regulatory filings, industry reports, and more in dozens of languages.
50K
50,000 global companies, ETFs, and all major asset classes analyzed.
1M
Each day, EquBot analyzes over one million global news articles, social media posts, financial statements, regulatory filings, industry reports, and more in dozens of languages.
50K
50,000 global companies, ETFs, and all major asset classes analyzed.
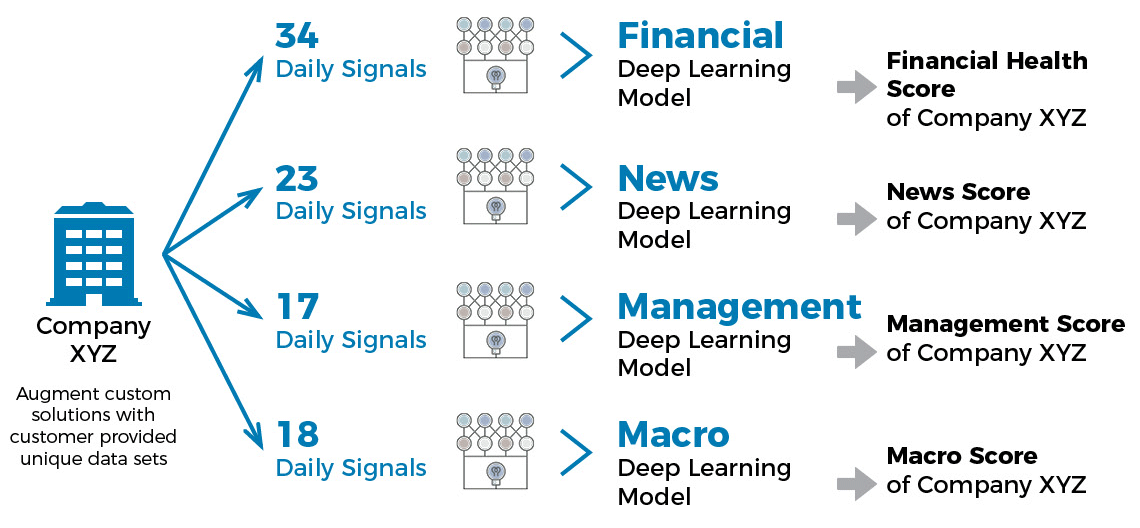
Deep Learning Investment Models
50,000 Companies x 4 Models Per Company =
200,000 Company Specific Deep Learning Models Running Continuously

Non Exhaustive Data Source Sample
Financial Health Score:
Evaluates each company’s fundamentals
- Sales/Revenue
- COGS
- R&D Expense
- SG&A Expense
- Depreciation & Amortization
- Interest Expense
- Non-Operating Income/Loss
- Income Taxes
- Minority Interest in Earnings
- Other Income (Loss)
- Ext. Items & Disc. Ops.
- Preferred Dividends
- Operating Cash and Market Sec.
- Receivables
- Inventories
- Other Current Assets
- PP&E (Net)
- Investments
- Intangibles
- Other Assets
- Current Debt
- Accounts Payable
- Income Taxes Payable
- Other Current Liabilities
- Long-Term Debt
- Other Liabilities
- Deferred Taxes
- Minority Interest
- Preferred Stock
- Paid in Common Capital (Net)
- Retained Earnings
- Common Dividends
- EBITDA
- EPS
News and Information Score:
Measures each company’s market sentiment, economic and geopolitical risks
- Analyst Forecast on Earning (EPS)
- Analyst Growth forecast
- Last Trading Prices
- Trading Volume (Adj, Close) )
- RSI
- 52 Week High
- 52 Week Low
- Open Price
- News Sentiment
- Headline Frequency
- Social Med Sentiment
- Media Engagement
- Legal Involvement
- Production loss
- Earnings Revision
- Crisis Response
- Regulatory Changes
- Natural Disaster
- Customer sentiment
- New Products
- Strategic Partnership
- M&A Detail
- Correlated Company Sentiment
Management Score:
Assesses each company’s strength and thought leadership
- Compensation
- Net Sales Growth
- Expense Growth
- Geo Expansion
- Profit Growth
- ROA
- Credit Rating
- Earnings Surprise
- ROE
- Community Engagement
- Product Launch
- Headcount Growth
- ESG
- Innovation spend
- Customer Satisfaction
- Customer LTV
- Leadership Influence
Macro Score:
Gauges a country’s economic health
- Country Level GDP
- Forecasted GDP & GDP Growth
- Consumer Price Index
- Interest Rates by Country
- Retail Sales
- Housing Starts
- Unemployment
- Non-Farm Payrolls
- Money Supply
- Producer Price Index
- Consumer Confidence
- Remittance Data
- Precious Metal Mining & Production
- Agricultural GDP
- Gross National Income
- Underemployment Index
- Central Bank Leadership Sentiment
- Central Bank Leadership Influence
